KOTI Insight

RESEARCH
KOTI - Korea Transport institute
KOTI Insight Vol.1 No.3
- Date
November 30 2025
- Authors
김영호
- Page(s)
11 page(s)
Public Transit Vulnerability Assessment and Improvement Strategies for Regional Balanced Development and Mobility Industry Activation
Youngho Kim
Youngho Kim
KEY SUMMARY
This study aims to propose strategies to address interregional disparities in public transportation and to establish a sustainable mobility system. Since the launch of the 2004 Five-Year National Balanced Development Plan, the government has promoted regional industrial growth and improved living conditions, yet the gap in transportation accessibility and service quality between the Seoul metropolitan area and non-metropolitan regions continues to widen. The uneven provision of public transit services restricts residents’ mobility rights and contributes to widening economic disparities across regions. Although new mobility services―including car sharing, autonomous vehicles, personal mobility (PM), and demand-responsive transit (DRT)―have emerged, their expansion remains constrained by regulatory limitations and insufficient infrastructure.
In response, this study quantitatively evaluates public transit vulnerabilities in terms of availability, accessibility, and mobility, and proposes strategies that leverage advanced mobility technologies to address these weaknesses. Availability was assessed based on service frequency and coverage, accessibility based on distance to transit stops and terrain slope, and mobility based on transfer distance, waiting time, and other factors related to operational efficiency. The analysis indicates that while nationwide public transit connectivity is generally adequate, efficiency and accessibility remain low in non-metropolitan, island, and mountainous areas. Slope and elevation differences were found to have significant impacts on accessibility, and small cities and rural areas exhibited reduced mobility efficiency due to inconvenient transfers and service discontinuities.
Based on these findings, four improvement strategies are proposed. First, establishing a tiered mobility hub system is necessary to enhance interregional connectivity and improve transit availability. Second, expanding DRT services and optimizing dispatching through data-driven methods can help eliminate mobility blind spots. Third, private vehicle ride-sharing should be introduced in areas where conventional transit services are difficult to operate to supplement residents’ mobility options. Fourth, improving PM infrastructure and standardizing geofencing are required to enhance safety and accessibility.
In addition, institutional foundations must be strengthened through measures such as establishing a Mobility Rights Act, reforming regulations to permit ride-sharing, introducing a registration system for PM operators, and mandating data management requirements. By combining analytical insights with actionable recommendations, this study provides a systematic assessment of regional public transit vulnerabilities and proposes mobility technology-based solutions that can support transportation equity and balanced regional development.
01 Overview of the Study
Since the establishment of the First Five-Year National Balanced Development Plan in 2004, the Korean government has implemented various policies aimed at fostering regional industries, improving quality of life, and promoting locally specialized development. However, disparities in population, economic capacity, living services, and particularly regional imbalances in public transportation between the metropolitan and non-metropolitan areas have continued to deepen.
In the post-COVID era, the expansion of platform-based mobility services has accelerated the emergence of new mobility industries centered on technologies such as car sharing, autonomous driving, and urban air mobility (UAM). Korea is also expanding customized services such as DRT and PM under the “Platform-Based Transportation Service Promotion Plan,” yet regulatory conflicts and insufficient infrastructure continue to constrain widespread adoption.
Accordingly, this study aims to quantitatively analyze vulnerabilities in public transportation services and propose policy measures leveraging advanced mobility technologies to address these weaknesses. Public transit vulnerability was categorized into three dimensions―availability, accessibility, and mobility―and analyzed using nationwide transit network data, PM trip data for the Seoul metropolitan area, and nationwide travel records.
Based on the analysis, the study proposes the development of a tiered mobility hub system to enhance network efficiency, the expansion of demand-responsive modes to improve mobility, the introduction of private vehicle ride-sharing in areas with limited transit service, and improvements in PM infrastructure to enhance accessibility. The study also suggests legal and institutional support measures to help resolve regional transit vulnerabilities and contribute to building a sustainable mobility ecosystem that promotes transportation equity.
02 Methodology for Assessing Public Transit Trip Vulnerability
Assessment of Public Transit Availability Vulnerability
The analysis of transit availability vulnerability examines, in spatial and temporal terms, whether current public transportation systems―based on their design and operating conditions―are convenient and usable for riders. The indicators used for assessment include efficiency, connectivity, and service coverage.
Network efficiency measures how rapidly and effectively each node within the network can connect to other nodes.This can be evaluated using Harmonic Closeness Centrality, which represents the sum of the inverse distances between all node pairs in the network.

Network connectivity can be assessed using centrality metrics such as degree centrality, closeness centrality, betweenness centrality, and eigenvector centrality.

"Network efficiency measures how rapidly and effectively each node within the network can connect to other nodes."
Service coverage refers to the extent to which users can reach desired areas or activities within an appropriate travel time. To measure this, accessibility indicators are applied using travel time as an impedance function, with population, employment, and facilities serving as destination variables. When evaluating service coverage based on public transit, supplementary indicators may include areas and distances reachable within 30 minutes via direct service, one transfer, or two transfers. In addition, the concept of regional average service coverage is proposed to calculate average accessibility across a broader metropolitan area.

For this analysis, all public transit routes nationwide were mapped onto a 500m × 500m grid, with each grid cell designated as a node and the routes connecting nodes represented as links. In cases where direct connections existed between grid cells without transfers, these were modeled as separate links to distinguish direct services from transfer-based connections and to highlight the significance of direct transit routes within the network.
Assessment of Public Transit Accessibility Vulnerability
The assessment of transit accessibility vulnerability identifies factors and areas where reaching public transit services is inconvenient. In this study, the analysis consisted of three components: a survey of shared PM users, focus group interviews (FGIs), and a vulnerability analysis using PM usage data.
| Mobile Survey
A mobile survey was conducted to identify usage patterns of shared PM users and to derive potential improvement measures. The survey consisted of questions on current PM usage and strategies for promoting utilization, and results were compared between actual users and non-users in 2023. To further analyze the spatial and temporal characteristics of usage, focus group interviews (FGIs) were conducted with loyal users to examine frequent users’ behavior, safety concerns, and factors influencing increased utilization.
|In-depth Interviews
In-depth interviews were conducted with frequent users of various ages and occupations, focusing on key issues identified through the survey. The interview covered four areas: current usage, linkage with public transit, promotion and improvement strategies, and safety. Participants were asked detailed questions regarding strengths, weaknesses, and required improvements not easily identified in closed-ended surveys, and follow-up questions were used to analyze usage purposes, patterns, and perceived effects. The interviews specifically examined real-world usage behaviors such as PM-public transit transfer patterns, preferred travel distance, and preferred return locations, while safety-related questions addressed exclusive lanes, designated parking zones, and geofencing.
| Shared PM-Public Transit Vulnerability Analysis
Using findings from the survey and interviews, the study analyzed shared PM users’ ravel purposes and patterns, and identified spatial and temporal usage characteristics through actual trip data. Statistical datasets at the census block level were developed for Gwanak-gu, Dongjak-gu, and Songpa-gu, incorporating population, employment, housing, and transportation facility variables, and their correlations with PM usage were examined. Shared PM trip rates were calculated using resident population estimates for each census block, and classified by quantiles to compare hourly trip volumes and travel distances. This allowed for an examination of the relationship between areas with high PM usage and those vulnerable in terms of public transit.
Public Transit Mobility Vulnerability Analysis
The analysis of transit mobility vulnerability assessed whether travel to desired destinations was feasible using public transportation alone and compared public transit and automobile travel times between origins and destinations. To support this, optimal automobile and public transit routes were extracted using the T-Map API, and mobility and transfer-connectivity indicators were developed.
| Mobility Indicators
The transit-to-automobile travel time indicator measures how long public transit travel takes relative to automobile travel. The MOB_T indicator intuitively represents the ratio of public transit travel time to automobile travel time. The normalized indicator, MOB_norT (ranging from 0 to 1), allows for the evaluation of this metric within specific trip-type groups to determine relative mobility conditions.

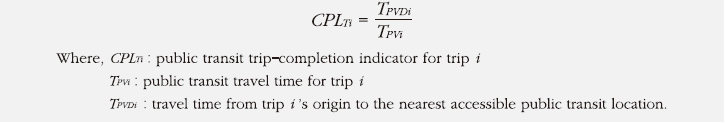
The trip completion indicator evaluates whether a user can complete a trip to the desired destination using public transit at the preferred time. For example, in rural areas, service schedules may not align with the user’s intended departure time, preventing transit use; the indicator reflects these circumstances. If the user is unable to use the very first required transit service, the indicator value is 0; if all necessary transit stages can be completed to reach the destination, the value is 1.
" The assessment of transit accessibility vulnerability identifies factors and areas where reaching public transit services is inconvenient. In this study, the analysis consisted of three components: a survey of shared PM users, focus group interviews (FGIs), and a vulnerability analysis using PM usage data."
| Transfer Connectivity Indicators
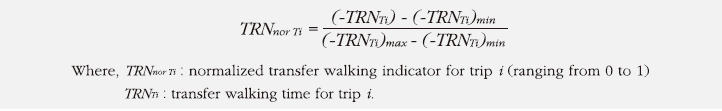
The transfer walking-time indicator measures the amount of walking required to transfer between public transit modes during a trip from origin to destination. Longer walking times indicate higher inconvenience and greater vulnerability in transit use. The indicator ranges from 0 to 1, with lower values representing higher vulnerability.
The transfer frequency indicator evaluates vulnerability based on the number of transfers required; more transfers indicate greater inconvenience and higher vulnerability. As with the previous indicator, lower values indicate greater vulnerability.

A transfer connectivity index was developed by calculating the geometric mean of the walking-time and transfer-frequency indicators. The geometric mean was used instead of a simple average to appropriately reflect proportional relationships and reduce the influence of extreme values.

03 Results of the Public Transit Trip Vulnerability Assessment
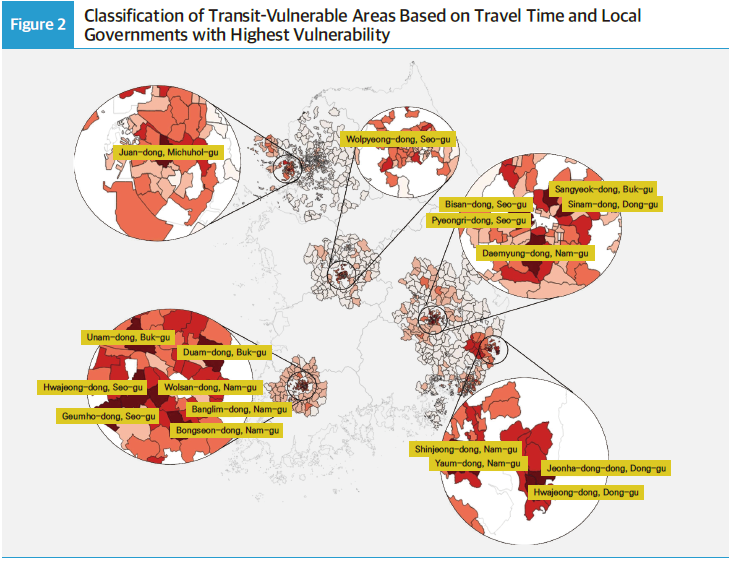
Results of the Transit Availability Vulnerability Assessment
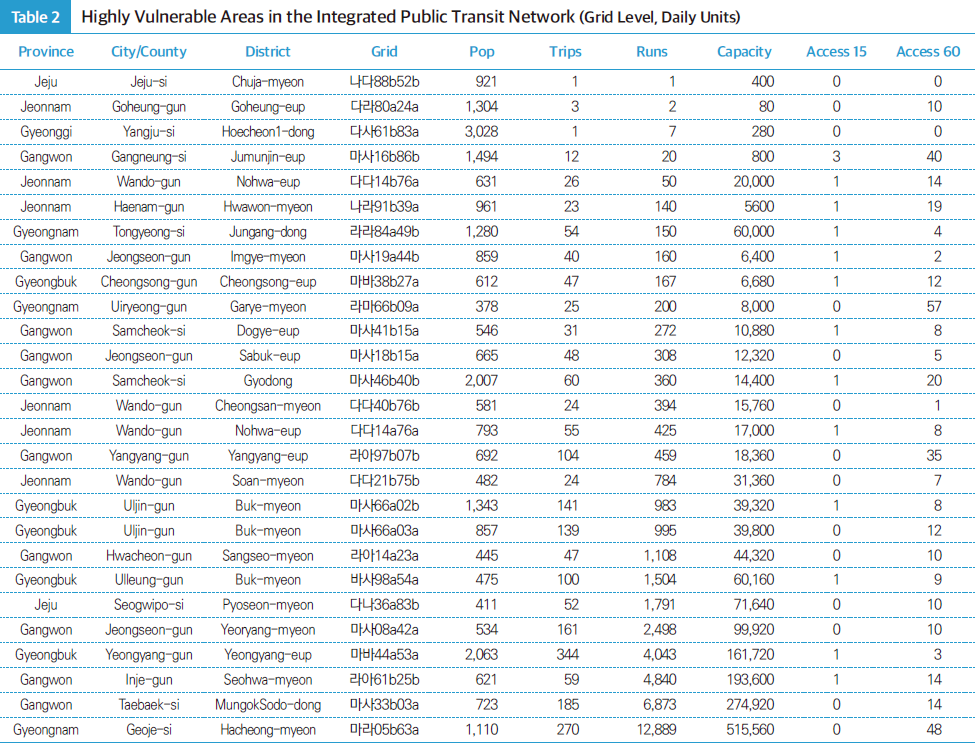
Among 71,823 grid cells nationwide, 1.4% were identified as vulnerable areas and 0.04% as highly vulnerable areas. Vulnerability levels were relatively high in Gangwon Special Self-Governing Province, North Gyeongsang Province, Daegu Metropolitan City, Incheon Metropolitan City, South Gyeongsang Province, and South Jeolla Province.→ Certain areas classified as highly vulnerable―including Chuja-myeon in Jeju, Goheung and Wando in South Jeolla, and Gangneung, Samcheok, and Jeongseon in Gangwon― require urgent improvement measures.
Results of the Accessibility Vulnerability Assessment
Accessibility-vulnerable areas were identified using shared PM data based on the elevation (m) and slope (°) of rental and return locations. Boramae-dong and Cheongnim-dong in Gwanak-gu, and Sangdo-dong in Dongjak-gu, Seoul, were classified as accessibility-vulnerable zones. These areas showed relatively high elevations and steep gradients, along with high shared PM usage rates.
"Certain areas classified as highly vulnerable—including Chuja-myeon in Jeju, Goheung and Wando in South Jeolla, and Gangneung, Samcheok, and Jeongseon in Gangwon—require urgent improvement measures."
Results of the Mobility Vulnerability Assessment
Mobility-vulnerable segments were identified by analyzing travel times and trip completion levels, focusing on public transit accessibility and transfer connectivity. The analysis of areas with inefficient public transit travel times relative to automobile travel showed the highest share of vulnerable segments for trips departing at 12:00 p.m., with the disparity decreasing during peak commuting hours. This is because automobile congestion increases during peak periods, making public transit relatively more efficient.
Among major metropolitan cities, Gwangju and Ulsan recorded the highest proportions of vulnerable segments, whereas Seoul and Busan showed relatively low levels. Within large metropolitan regions, the Gwangju area exhibited the highest vulnerability rate, while the Seoul metropolitan area showed comparatively low levels.
The trip completion analysis indicated that many areas in non-metropolitan regions showed low completion rates, meaning public transit could not feasibly support full trips. Provinces such as Gangwon, Jeollabuk-do, Jeollanam-do, and Chungcheongbukdo exhibited the lowest levels of trip completion, indicating significant deficiencies in transit accessibility. In particular, minimal public transit service was observed in certain township-level areas such as Ulleung-gun, Hwacheon-gun, Jeungpyeong-gun, and Muju-gun, requiring urgent intervention.
"Among major metropolitan cities, Gwangju and Ulsan recorded the highest proportions of vulnerable segments."
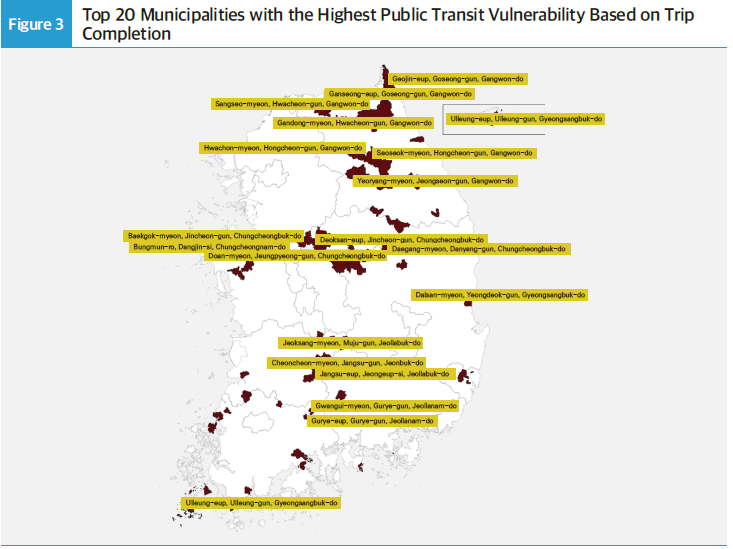
"Provinces such as Gangwon, Jeollabukdo, Jeollanam-do, and Chungcheongbuk-do exhibited the lowest levels of trip completion, indicating significant deficiencies in transit accessibility."
04 Strategies for Improving Public Transit Trip Vulnerability
Development of Mobility Hubs
A hierarchical mobility hub system must be established and managed to enhance public transit availability. Primary hubs serve as regional transfer centers, secondary hubs support intra-area connectivity and user inflow, and tertiary hubs function as anchors for short-distance trips and localized services. Hub locations should be determined based on network connectivity, efficiency, and service coverage, and spatially balanced using factors such as population density, travel demand, and land use to minimize regional disparities.
Expansion of Demand-Responsive Mobility (DRM)
To address low ridership and high operating costs associated with DRT, a sustainable operating model should be established through public investment and private-sector partnerships, along with the adoption of regional-scale service models. Accessibility can be improved by developing data-driven implementation criteria, applying AIbased dispatch optimization, and introducing diverse request methods, while localized operations and resident participation can further enhance service efficiency.
Introduction of Private Vehicle Ride-Sharing
In public transit-vulnerable areas, private vehicle ride-sharing can be introduced as an alternative mobility option. Ride-sharing may be permitted not only during commuting hours but also at other times if specific conditions are met, and sustainability can be enhanced through cooperative-based operations. A phased approach is needed, beginning with regulatory sandbox pilots and eventually institutionalizing the system.
05 Policy and Regulatory Reform Measures
Establishment of a Legal Framework to Guarantee Transit Accessibility and Mobility
Although Korea’s transportation policy has traditionally focused on infrastructure expansion, there is a lack of legal foundation recognizing mobility rights as a basic right. In other countries such as France, the United Kingdom, and Japan, minimum mobility standards are defined by law to ensure transportation welfare. Korea should similarly enact a Basic Mobility Act to guarantee minimum mobility services nationwide and clearly define concepts and standards related to availability, service coverage, and mobility. In areas where conventional public transit cannot be provided, the adoption of innovative mobility services should be mandated.
Regulatory Reform for Private Vehicle Ride-Sharing
The current Passenger Transport Service Act prohibits paid transportation using private vehicles, limiting mobility alternatives in transit-vulnerable regions. Legal amendments are needed to permit ride-sharing in designated areas, and the system should be institutionalized through consultation with existing transport operators. Pilot projects should be conducted using resident-participatory cooperative models, followed by phased institutionalization.
Legislative Measures for PM Promotion
Despite the growing use of PMs, institutional frameworks for proper management remain insufficient. A registration system for PM rental operators and mandatory data reporting requirements should be introduced to analyze usage patterns and support parking optimization and safety policy development. Local governments and service operators should collaborate to expand parking facilities and ease regulations, while a contribution-based funding mechanism should be adopted to support required infrastructure.
06 Conclusion
This study aimed to analyze vulnerabilities in the public transit system and present improvement strategies to promote balanced regional development and mobility industry advancement. As mobility gaps have widened due to transit disparities between metropolitan and non-metropolitan regions and institutional limitations, the study proposed improvement strategies utilizing innovative services such as PM and DRT.
The analysis categorized transit vulnerabilities into availability, accessibility, and mobility. Availability vulnerabilities stemmed from service frequency, capacity, and coverage; accessibility vulnerabilities were related to stop distance and terrain conditions; and mobility vulnerabilities were linked to transfer time, detour length, and similar factors.
The findings indicated lower efficiency and accessibility in non-metropolitan regions, with smaller cities showing pronounced service discontinuities and limited late-night transit availability. Based on these results, several measures were proposed, including establishing regional mobility hubs, expanding DRT, permitting ride-sharing, and improving PM infrastructure. This study provides a structured diagnosis of regional transit vulnerabilities and highlights the need for policy direction and future evaluation frameworks to build a sustainable transportation system.
"This study provides a structured diagnosis of regional transit vulnerabilities and highlights the need for policy direction and future evaluation frameworks to build a sustainable transportation system."
[ References ]
Kim, C., Kang, D., & Park, I. (2023). Reforming the Evaluation Framework for Transport SOC Investment in the Era of Regional Balance and Carbon Neutrality . Korea
Transport Institute.
Mo, C. (2010). Proposal for Enacting the Basic Mobility Act. KOTI Occasional Study 2010-12. Korea Transport Institute.
Mo, C., Park, J., & Park, S. (2013). Developing Minimum Service Standards and Measurement Methods to Ensure Basic Mobility Rights: Focusing on Rural Bus and DRT Services . Research Series 2013-15. Korea Transport Institute.
Lee, Y., & Jeong, I. (2002). A Study on Road Development Demand Considering Social Equity . Korea Research Institute for Human Settlements.
Lee, J., Park, S., & Yoo, J. (2016). Analysis of Transit-Vulnerable Areas Using Minimum Service Indicators . Proceedings of the 75th Conference of the Korean
Society of Transportation.
Jang, D., Kim, C., Lee, S., & Hong, S. (2016). Assessment of Transportation Accessibility in Korea . Korea Transport Institute.
Jang, W., Kwon, Y., & Yoo, J. (2011). Development of Equity Evaluation Indicators for the Transportation Sector . Korea Transport Institute.
Cho, N. (2002). A Study on Road Network Development Directions for Efficient Land Use . Korea Research Institute for Human Settlements.
Hong, S., Yoon, H., Yoo, K., & Yeon, J. (2019). Developing and Applying an Evaluation Method for Public Transit Service Vulnerable Areas in Seoul. Seoul Institute.
Menczer, F., Fortunato, S., & Davis, C. (2022). A First Course in Network Science . Acorn Publishing.
Allen, W. B., Liu, D., & Singer, S. (1993). Accessibility measures of U.S. metropolitan areas. Transportation Research Part B: Methodological , 27(6), 439-449.
01 Overview of the Study
02 Methodology for Assessing Public Transit Trip Vulnerability
03 Results of the Public Transit Trip Vulnerability Assessment
04 Strategies for Improving Public Transit Trip Vulnerability
05 Policy and Regulatory Reform Measures
06 Conclusion
02 Methodology for Assessing Public Transit Trip Vulnerability
03 Results of the Public Transit Trip Vulnerability Assessment
04 Strategies for Improving Public Transit Trip Vulnerability
05 Policy and Regulatory Reform Measures
06 Conclusion